
Arrow Ballistics Study | 2026
Vane Shape, Size, and Performance
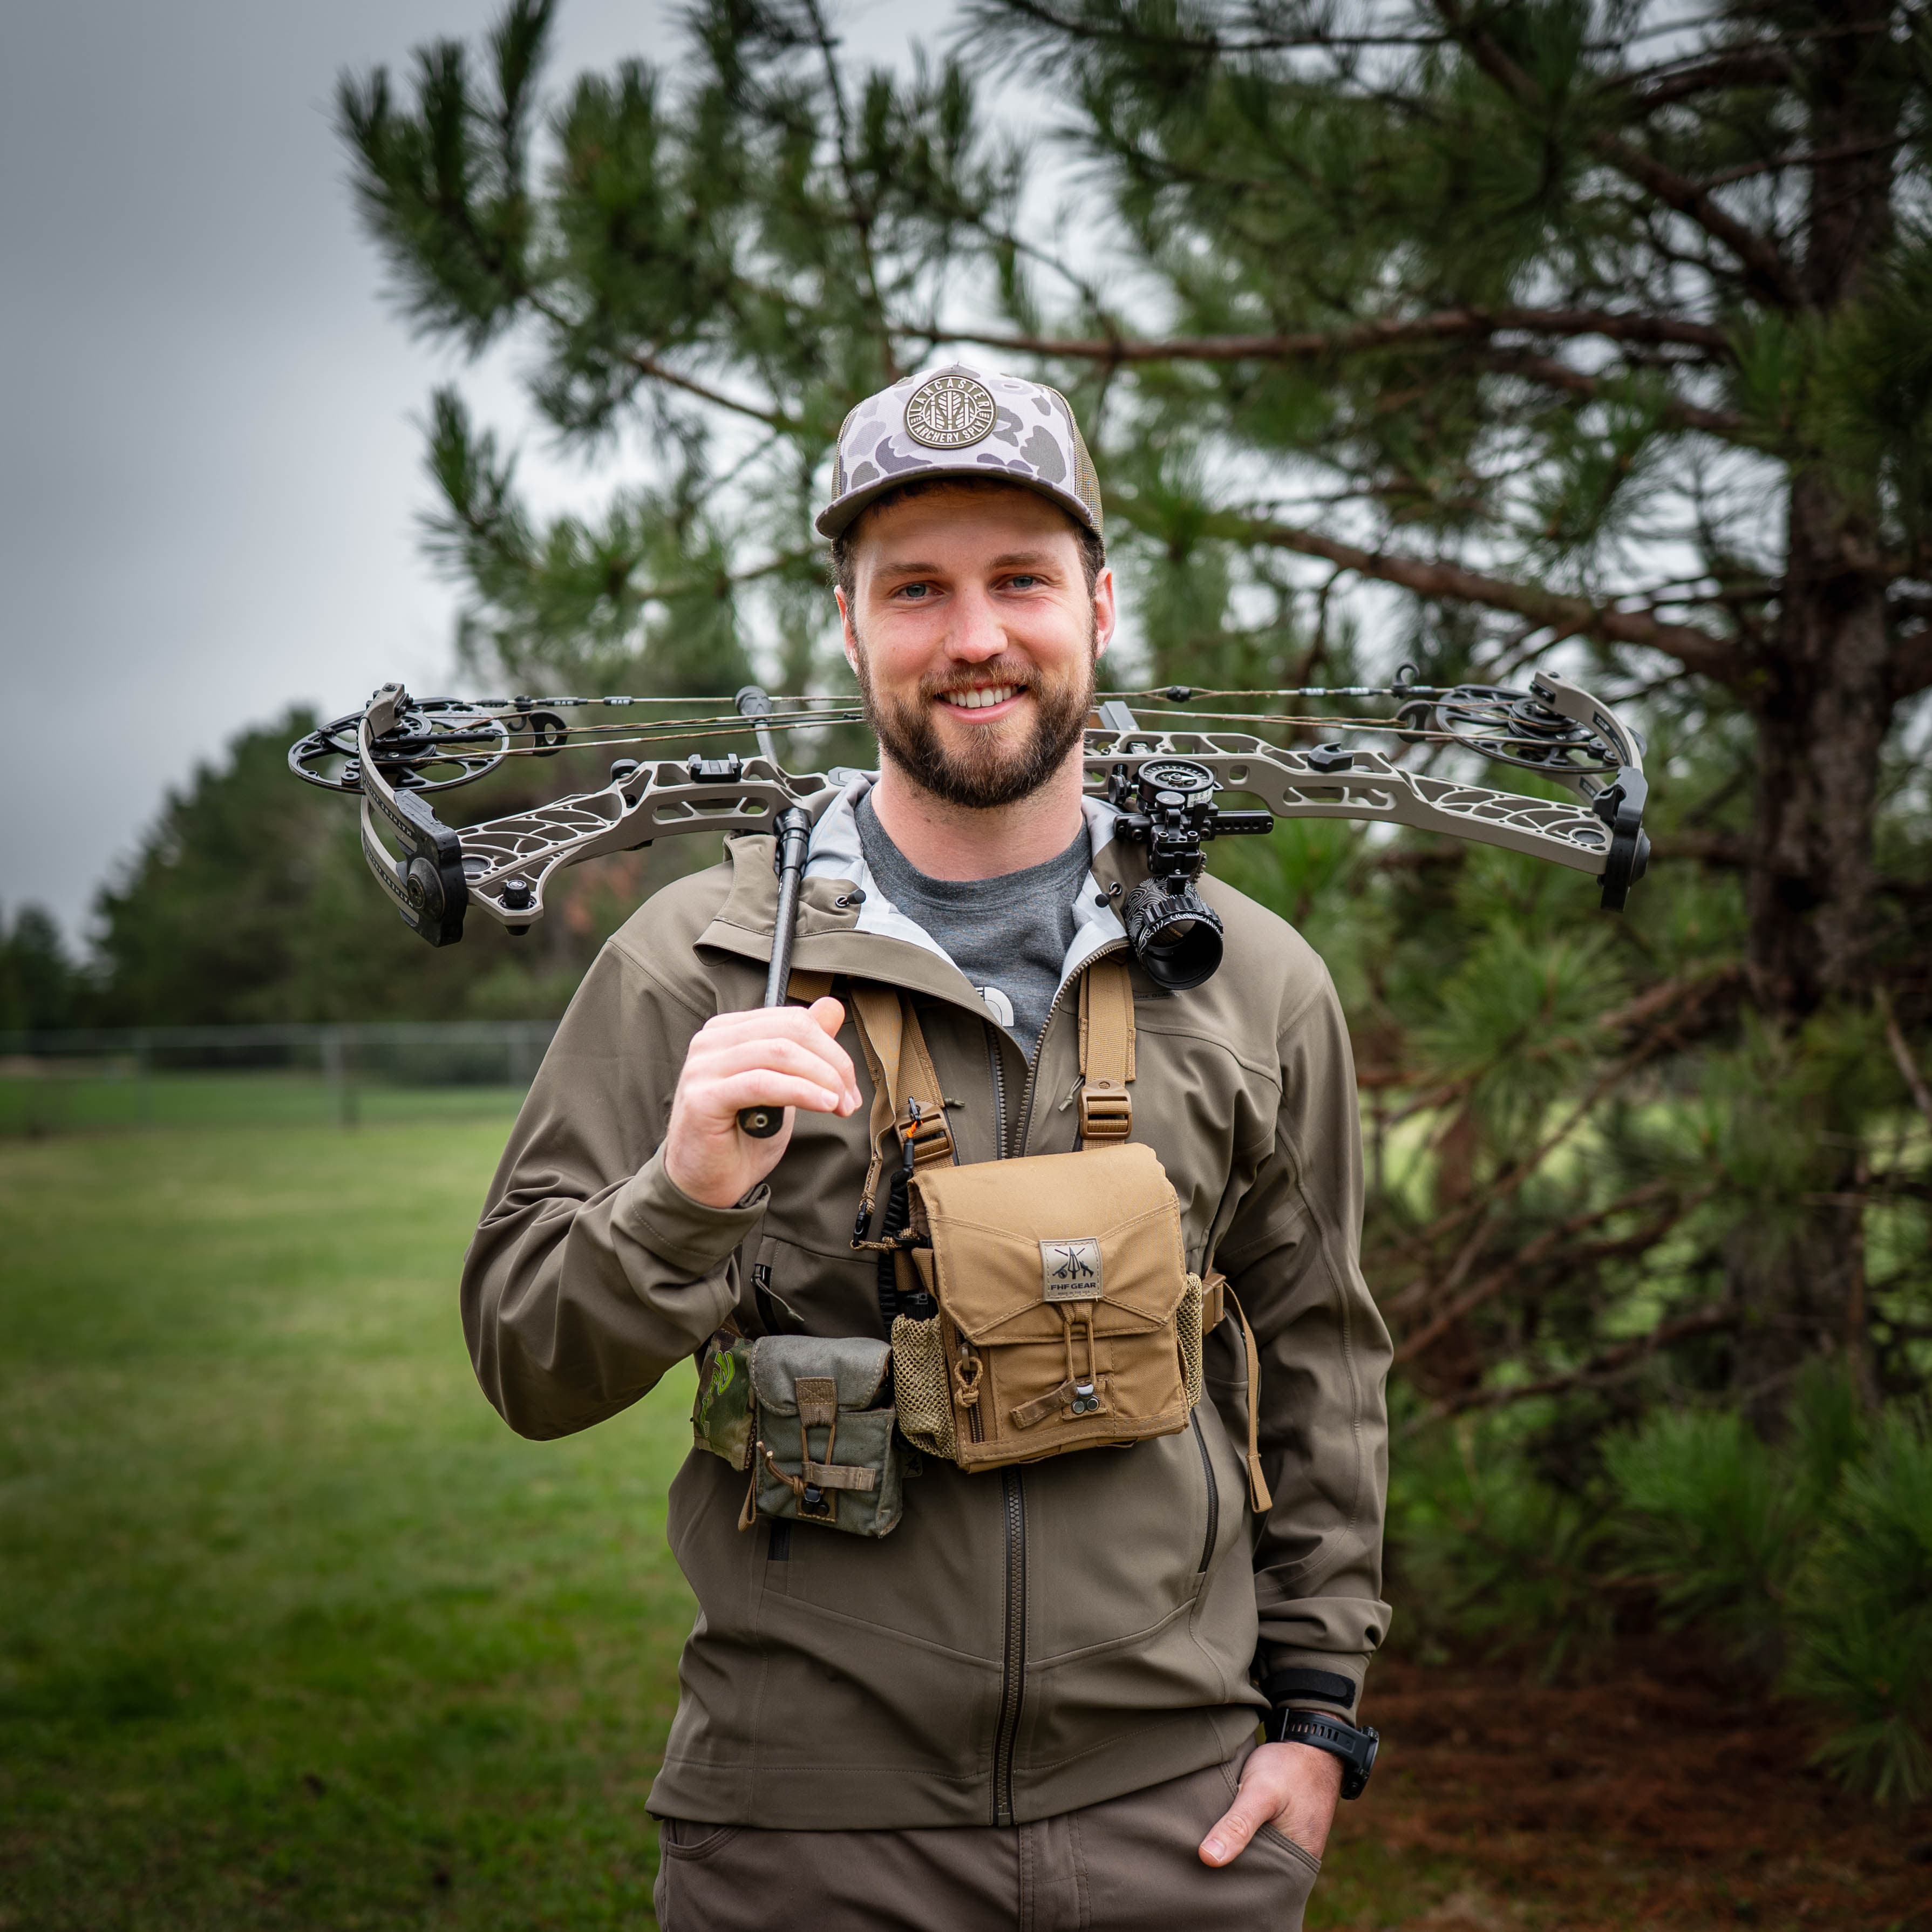
May 13, 2026
Tristan Litke
Founder, Precision Cut Archery
Overview
Vanes vary on a lot of dimensions: profile shape, length, height, thickness, stiffness, base footprint, surface finish, and more. This article looks at the two we can measure cleanly across every build in the test (length and height) and asks which one drives which performance metric.
Same protocol as the rest of the vane study. Standard-speed rig: 28″ draw length, 70# draw weight, ~450gr arrows, ~290 fps out of a Hoyt AX3 33. Each build was measured on three performance axes:
- Aerodynamic Drag: calculated drag constant from synced chronograph readings at 0.5, 30, and 60 yards. Lower is better.
- Restorative Lift: how strongly the vane pulls the broadhead back toward the field-point baseline under simulated shooter error (induced lateral torque), measured at 70 yards with an Iron Will Wide fixed-blade head and a Gold Tip 100gr field point. The y-axis on the lift plots is the lateral offset between the broadhead and field-point groups; a smaller offset means more restorative lift. Lower is better.
- Deer-Weighted Lmax: overall peak loudness in flight, weighted for whitetail deer hearing. Lower is better.
What we're not measuring: the rest of the geometry. Profile shape (parabolic vs. shield vs. flat-back), thickness, stiffness, surface texture, base footprint, helical or offset attachment angle. All of those almost certainly move results inside a given length / height. Two vanes with identical length and height can perform very differently if they're shaped or built differently. Read the rest of this article with that in mind.
For the broader vane comparison and per-build numbers, see the Vane Performance Overview.
Test Methods
For full details on the test methods, group capture, and analysis processes, check out the Methods page.
Quick Tips
Hover over the dots in any plot to see the build configuration and results details.
Each plot in the body sections has a fit line drawn through it. A steeper fit line means the dimension on X is doing more work on the metric on Y. A near-flat fit line means the relationship is weak.
The first three plots are colored 2D views of the same dataset. The remaining plots are per-dimension scatters against each performance metric.
Length vs. Height
The three plots below show the same scatter (length on X, height on Y, one dot per vane build) recolored by each performance metric in turn. Quick visual scan of where the best builds cluster on each axis. Yellow = better.
Standard Speed Vanes | Vane Length vs. Vane Height (colored by Lmax (deer))
Per-build vane geometry with deer-weighted overall peak loudness as color. Each point is one vane build; yellower (quieter) dots are the best performers for a given shape.
(louder = purple)
Standard Speed Vanes | Vane Length vs. Vane Height (colored by Torque-Induced Broadhead Drift from Field Point)
Per-build vane geometry with torque-induced broadhead drift from field point as color. Each point is one vane build; yellower (less drift) dots are the best performers for a given shape.
(more drift = purple)
Standard Speed Vanes | Vane Length vs. Vane Height (colored by Drag)
Per-build vane geometry with aerodynamic drag constant as color. Each point is one vane build; yellower (lower drag) dots are the best performers for a given shape.
(more drag = purple)
Vane Height
Holding length out of the picture, how does height alone move each metric? The three plots below put vane height on X and one of drag, restorative lift, and deer-Lmax on Y, with a fit line on each.
Height moves all three metrics, but the strongest relationships are with noise (taller is louder) and restorative lift (taller has more lift). The relationship with drag is real but weaker than either of those.
Standard Speed Vanes | Vane Height vs. Drag
Per-build vane height vs. aerodynamic drag. Each point is one vane build.
Standard Speed Vanes | Vane Height vs. Torque-Induced Broadhead Drift from Field Point
Per-build vane height vs. torque-induced broadhead drift from field point. Each point is one vane build.
Standard Speed Vanes | Vane Height vs. Lmax (deer)
Per-build vane height vs. deer-weighted overall peak loudness. Lower overall peak loudness is quieter to a whitetail deer. Each point is one vane build.
Vane Length
Same view, with length on X.
Length is inversely related to noise (longer is quieter, the opposite direction from height) and is the stronger of the two single dimensions for predicting drag (r = 0.40 vs. 0.20 for height). The relationship with restorative lift is weak on its own (r = -0.13); length affects restorative lift mostly through the combined length × height view below.
Standard Speed Vanes | Vane Length vs. Drag
Per-build vane length vs. aerodynamic drag. Each point is one vane build.
Standard Speed Vanes | Vane Length vs. Torque-Induced Broadhead Drift from Field Point
Per-build vane length vs. torque-induced broadhead drift from field point. Each point is one vane build.
Standard Speed Vanes | Vane Length vs. Lmax (deer)
Per-build vane length vs. deer-weighted overall peak loudness. Lower overall peak loudness is quieter to a whitetail deer. Each point is one vane build.
Length × Height
Length × height is a rough proxy for vane profile area. Rough because vanes aren't rectangles, so this overstates the actual area for shaped vanes by a constant factor that depends on the profile.
For drag, this combined view is the best predictor of the three (r = 0.44), beating length alone (r = 0.40) and height alone (r = 0.20).
For restorative lift, the combined view (r = -0.32) is weaker than height alone (r = -0.38).
Standard Speed Vanes | Vane Length × Height vs. Drag
Per-build vane length × height (a proxy for profile area) vs. aerodynamic drag. Each point is one vane build.
Standard Speed Vanes | Vane Length × Height vs. Torque-Induced Broadhead Drift from Field Point
Per-build vane length × height (a proxy for profile area) vs. torque-induced broadhead drift from field point. Each point is one vane build.
Standard Speed Vanes | Vane Length × Height vs. Lmax (deer)
Per-build vane length × height (a proxy for profile area) vs. deer-weighted overall peak loudness. Lower overall peak loudness is quieter to a whitetail deer. Each point is one vane build.
Takeaway
Vane height is the primary factor for steering performance. Tall vanes steer better, but they're also generally louder. Length is the moderating variable to reduce noise: longer vanes are generally quieter at the same height.
Drag and restorative lift don't share the same predictor, though. For drag, length × height (the profile-area proxy) is the best summary, beating either dimension alone. For restorative lift, height by itself is the strongest predictor.
In practice: pick the height that gives you the steering you need, then add length to keep it quiet. Height also has practical limits beyond aerodynamics (cable / rest clearance, face contact, etc.).
A few caveats:
- These are crude ways to look at vane shape and size. We are not measuring profile shape, thickness, stiffness, base footprint, surface finish, or any of the finer geometry that almost certainly moves results inside a given length / height. Two vanes with the same length and height can perform very differently.
- The length × height product treats every vane as a rectangle. Real vanes are shaped (parabolic, shield, etc.), so this overstates the actual area for most builds. It's a useful proxy, not a precise measurement.
- All testing was done on the standard-speed rig (~290 fps) on one type of arrow shaft. Builds that look great here may shift on a faster setup or a different arrow shaft.
Written by
Tristan Litke
Founder, Precision Cut Archery
Tristan Litke is the founder of Precision Cut Archery, a bowhunter, and a software engineer. For the 2026 Arrow Ballistics Study, he and his team led experiment design, data collection, analysis, and development of the website you're reading right now.